
Everything you need to understand what your audience is telling you

How It Works
Every TheySaid project includes two reporting tabs: Analytics and All Responses.

Start with a complete executive overview
Analytics opens with an executive overview covering total respondents, panel demographics, channel breakdown, and completion rates. Below that, your project goal and an AI-generated summary of findings appear side by side. Click "Create executive summary" to open the Ask AI sidebar with a full summary ready to share.

Explore tasks, questions, and AI-powered insights
Each task and question gets its own summary card. Tasks show success rate, theme count, responder count, average time on task, and frustration level. Questions show score distributions, themes, and frustration. Click into any card to see AI-detected themes color-coded by sentiment, with the number of users who experienced each one. Click a theme to expand it and see timestamped video clips from real sessions alongside AI-generated recommendations.

Review and filter every response in detail
All Responses shows every conversation summarized by AI, filterable by sentiment, completion rate, and conversation size. Click any entry to read the full transcript or share it with a teammate.
Key Benefits
Discover what you can do with TheySaid's analytics and reporting.
Get the Full Picture Before You Read a Single Response
The executive overview puts total respondents, panel demographics, channel performance, and completion rates at the top of every project. You know the shape of your data before you dig into a single question.
See What You Set Out to Learn, Summarized by AI
Your project's learning goal sits alongside an AI-generated summary of what the responses revealed. If you need more, one click opens the Ask AI sidebar with a full executive summary drafted and ready to share.
Go From Task to Theme to Evidence in One View
Click into any task or question to see AI-detected themes ranked by frequency and color-coded by sentiment. Each theme expands to show timestamped video clips from actual sessions and AI recommendations so you know exactly what happened and what to fix.
Scan Every Question Without Losing the Detail
Each task and question renders as a summary card on the Analytics page: success rates, themes, responder counts, average time, and frustration levels, all visible without clicking in. You can move through an entire project quickly and drill down only where it matters.
Review Every Conversation in Full
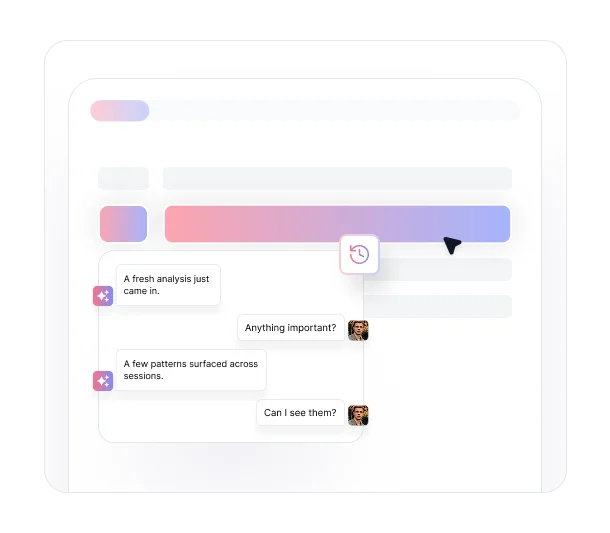
The All Responses tab gives you a complete list of every respondent with an AI-generated conversation summary. Filter by sentiment, completion rate, or conversation size. Click any entry to read the full transcript, or share it with a teammate using the link icon at the top of the response view.
Turn raw feedback into clear insight with AI reports.
See what customers say about our AI user testing platform
FAQs
Understand every insight before you read a single
response
Analyze complete reports with AI-generated summaries, detailed breakdowns, and full transcripts. Explore insights faster and share clear findings with your team.


TheySaid User testing recommends questions, delivers via your existing channels, engages your audience,and summarizes results through AI user testing, surveys, and interviews.
.svg)


