




Likert scales remain one of the most effective tools for gathering structured opinions in 2026. They let respondents indicate agreement, disagreement, or neutrality with clarity, turning subjective feelings into data that teams can trust. Originating from the work of Rensis Likert, this method has become foundational in behavioral research, psychology, and now customer feedback, wherever attitudes need to be measured accurately.
Summary
This guide brings you 60+ Likert scale questions across multiple use cases from customer satisfaction and employee engagement to product feedback, education, and healthcare. You’ll learn how Likert scales work, the different types you can use, and how to write clear, human-centered questions with balanced response options. Each example is crafted to help you collect meaningful data, understand audience sentiment, and make confident, data-driven decisions. Whether you’re building a survey, research form, or feedback tool, this collection has you covered.
History and Origins
The Likert scale was developed in 1932 by American social psychologist Rensis Likert as part of his doctoral dissertation at Columbia University. Likert sought to improve upon existing methods of measuring attitudes, which were often limited to simple yes/no responses.
Likert’s innovation was to develop a scale that could capture the intensity of feelings about a topic rather than just their direction (positive or negative). His original scale used five points of agreement: strongly approve, approve, undecided, disapprove, and strongly disapprove. This allowed for more nuanced measurements of attitudes and opinions.
While Likert originally pronounced his name “LICK-ert,” the scale is commonly pronounced “LIKE-ert” today. Regardless of pronunciation, Likert’s contribution revolutionized attitude measurement in psychology, sociology, market research, and other fields that rely on understanding human perceptions and behaviors.
What are Likert Scale Questions?
A Likert scale question is a common survey format used to measure people’s attitudes, opinions, or perceptions toward a specific topic. Unlike a simple “yes or no” question, it captures how strongly someone agrees or disagrees with a statement, giving richer and more actionable feedback.
For example:
“The onboarding process was clear and easy to follow.”
☐ Strongly disagree
☐ Disagree
☐ Neutral
☐ Agree
☐ Strongly agree
Depending on what you’re measuring, Likert scales can include three, five, or seven response options, usually ranging from one extreme to another, such as completely dissatisfied to completely satisfied, or strongly disagree to strongly agree.
Because they offer nuanced insight, Likert scale questions are often used to:
- Evaluate customer satisfaction with a product or service
- Measure employee engagement or workplace culture
- Understand user experience (UX) and design feedback
- Gauge public opinion or brand perception
In essence, Likert scale questions help you go beyond binary answers, allowing you to quantify emotions, satisfaction, and agreement levels for more data-driven decisions.
Components of a Likert Scale
The Statement or Question
The foundation of any Likert scale item is the statement or question being evaluated. For accurate and meaningful results, this component should be:
- Clear and unambiguous: Easy for respondents to understand
- Focused on a single concept: Measuring only one attitude or opinion at a time
- Relevant to the respondent: Addressing topics the respondent has experience with
- Balanced: Avoiding leading or biased language
The Response Options
The response options form the scale itself. These typically include:
- Anchor points: The labels at each end of the scale (e.g., “Strongly Disagree” and “Strongly Agree”)
- Intermediate points: Labels between the anchor points (e.g., “Disagree,” “Neither Agree nor Disagree,” “Agree”)
- Scaling: The number assignment to each response for quantitative analysis (e.g., 1–5 or 1–7)
Visual Presentation
How the Likert scale is presented visually can impact response patterns. Key aspects include:
- Layout: Horizontal or vertical arrangement of response options
- Spacing: Equal spacing between options to avoid suggesting some are more important
- Visual aids: Optional use of images, colors, or symbols to enhance understanding
Different Types of Likert Scale Questions You Can Use in Surveys
Likert scale questions aren’t limited to just measuring agreement. They can also help you understand satisfaction, frequency, importance, quality, effectiveness, and likelihood, giving you a well-rounded view of how people feel and behave.
Here are the seven most common types, explained with examples you can use right away:
1. Satisfaction Scale
Used to measure how content or pleased respondents are with a product, service, or experience. Perfect for customer experience surveys, post-purchase feedback, or training sessions.
Example:
How satisfied are you with the speed of our delivery service?
Options:
- Very dissatisfied
- Dissatisfied
- Neutral
- Satisfied
- Very satisfied
2. Agreement Scale
This classic version helps capture the degree of agreement or disagreement with a statement or opinion. Great for employee engagement, brand perception, and opinion-based surveys.
Example:
Please indicate how much you agree or disagree with the statement: “Our workspace encourages creativity.”
Options:
- Strongly disagree
- Disagree
- Neutral
- Agree
- Strongly agree
3. Likelihood Scale
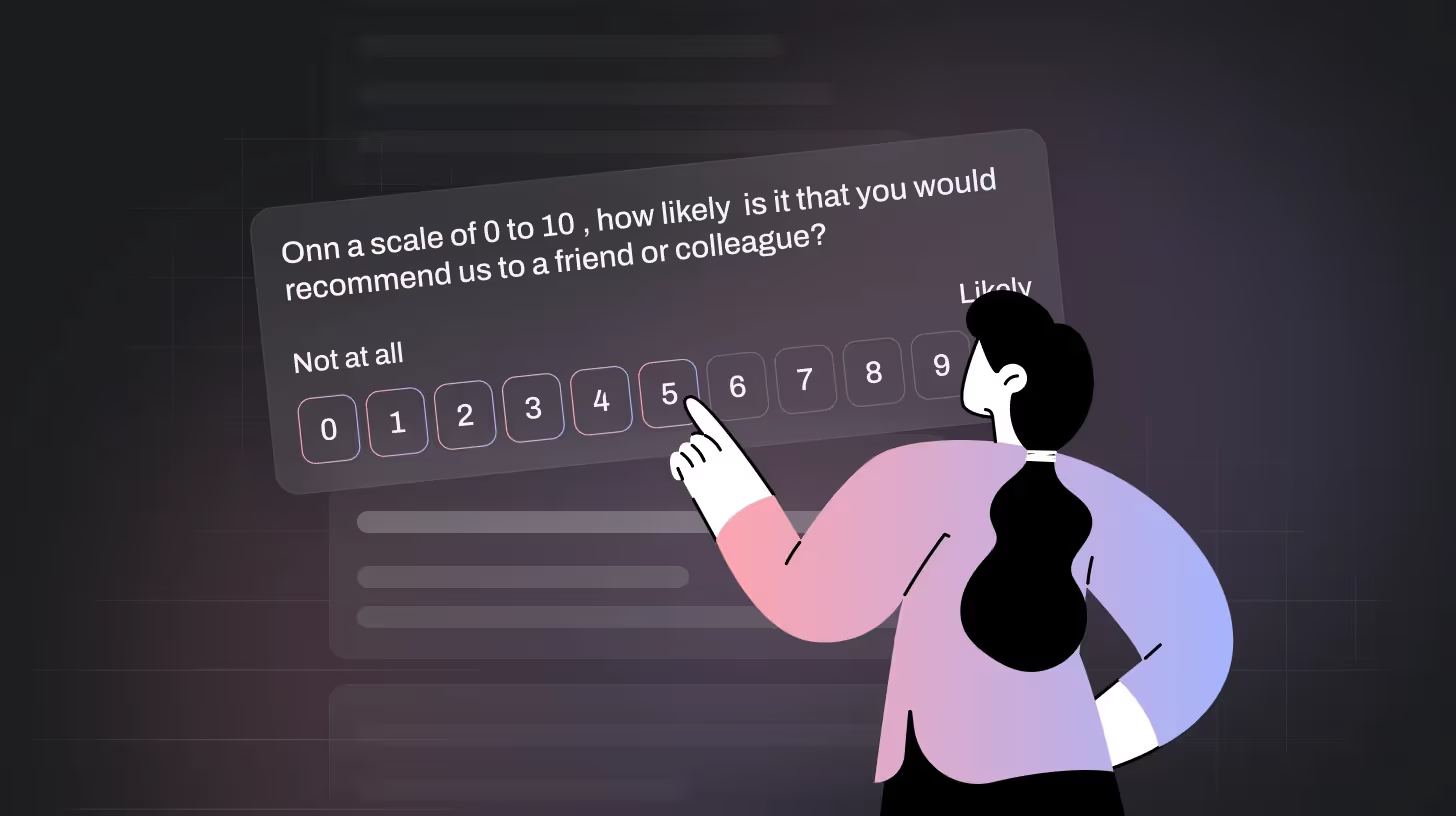
Use this to predict future behavior, like recommending a brand or using a feature again. Best for measuring loyalty, intent, or word-of-mouth potential.
Example:
How likely are you to continue using our app over the next six months?
Options:
- Not at all likely
- Unlikely
- Neutral
- Likely
- Extremely likely
4. Importance Scale
Helps you understand what your audience values most so you can prioritize improvements or product features. Ideal for feature prioritization, service design, and market research.
Example:
How important is it to you that our platform offers 24/7 live support?
Options:
- Not important
- Slightly important
- Neutral
- Important
- Very important
5. Frequency Scale
Measures how often a respondent performs a specific behavior or experiences something. Great for user behavior, habit tracking, or feature adoption surveys.
Example:
How often do you check your account analytics dashboard?
Options:
- Never
- Rarely
- Occasionally
- Often
- Always
6. Quality Scale
Evaluates how respondents perceive the standard or quality of something, from services to content to training. Best or service evaluations, product quality checks, or content performance feedback.
Example:
How would you rate the quality of the onboarding materials provided to you?
Options:
- Very poor
- Poor
- Average
- Good
- Excellent
7. Effectiveness Scale
Used to measure how well something works or achieves its intended goal. Ideal for training programs, marketing campaigns, or process improvements.
Example:
How effective was our recent workshop in improving your understanding of the product?
Options:
- Not effective at all
- Slightly effective
- Moderately effective
- Very effective
- Extremely effective
Pro Tip: You don’t have to stick to just one type! Most surveys combine a few of these scales to get a 360° view of audience perception, blending satisfaction and agreement, for example, to measure both what people feel and how strongly they feel it.
When to Use Likert Scales
Likert scales are most effective when:
1. Measuring Attitudes, Opinions, and Perceptions
When you need to understand how people feel about something rather than just factual information, Likert scales excel at capturing subjective attitudes that would be limited by yes/no questions.
2. Quantifying Qualitative Concepts
When you need to translate subjective feelings into numerical data for analysis, Likert scales bridge the gap between qualitative and quantitative research.
3. Tracking Changes Over Time
When you want to monitor shifts in sentiment, satisfaction, or other attitudes, Likert scales provide a consistent measurement framework that allows for longitudinal comparison.
4. Comparing Groups
When you need to identify differences in attitudes or perceptions between demographic groups, departments, or other segments, Likert scales facilitate statistical comparisons.
5. Gathering Feedback on Multiple Dimensions
When you want to evaluate various aspects of a product, service, or experience, Likert scales can be applied consistently across different dimensions for holistic assessment.
4-point to 10-point Likert Scales: What’s the Difference?
Difference Between Bipolar Scale & Unipolar Scale
A bipolar scale measures attitudes along two opposite ends, like satisfied vs. dissatisfied or agree vs. disagree. A unipolar scale, on the other hand, measures the intensity of a single feeling like importance, satisfaction, or likelihood without framing the response as opposites. Here’s a quick table for their difference:
Use Cases of Likert Scale Questions and Examples
Below are some of the most common use cases of Likert scale questions, complete with examples for each to guide your next survey design.
Customer Experience Surveys
Customer experience surveys help brands understand how customers feel after interacting with their product, website, or support team. These insights are key to improving satisfaction, loyalty, and service quality.
Satisfaction Scale
- How satisfied were you with your overall shopping experience?
Very dissatisfied | Dissatisfied | Neutral | Satisfied | Very satisfied - How satisfied are you with the speed of our delivery process?
Not satisfied at all | Slightly satisfied | Neutral | Mostly satisfied | Completely satisfied - How happy are you with the friendliness of our support team?
Very unhappy | Somewhat unhappy | Neutral | Happy | Very happy - How would you rate your satisfaction with our return policy?
Very poor | Poor | Fair | Good | Excellent
Agreement Scale
- I feel that this company values its customers.
Strongly disagree | Disagree | Neutral | Agree | Strongly agree - The website made it easy to find what I was looking for.
Strongly disagree | Disagree | Neutral | Agree | Strongly agree - The checkout process felt smooth and secure.
Strongly disagree | Disagree | Neutral | Agree | Strongly agree
Importance Scale
- How important is it for you that support is available 24/7?
Not important | Slightly important | Moderately important | Very important | Extremely important - How important is free shipping when deciding to purchase online?
Not at all important | Somewhat important | Important | Very important | Essential
Quality Scale
- How would you rate the overall quality of our product?
Very poor | Poor | Average | Good | Excellent - How would you describe the usability of our website?
Very difficult | Somewhat difficult | Neutral | Easy | Very easy

Employee Engagement & Workplace Culture
Employee engagement surveys explore how motivated, supported, and valued employees feel in the workplace. These questions help organizations strengthen culture and retention.
Satisfaction Scale
- How satisfied are you with your current role and responsibilities?
Very dissatisfied | Dissatisfied | Neutral | Satisfied | Very satisfied - How happy are you with your work-life balance?
Extremely unhappy | Unhappy | Neutral | Happy | Extremely happy
Agreement Scale
- I feel that my manager values my input.
Strongly disagree | Disagree | Neutral | Agree | Strongly agree - Communication across teams is open and transparent.
Strongly disagree | Disagree | Neutral | Agree | Strongly agree
Frequency Scale
- How often do you receive recognition for good performance?
Never | Rarely | Sometimes | Often | Always - How often do you get constructive feedback from your supervisor?
Never | Occasionally | Monthly | Weekly | Daily
Effectiveness Scale
- How effective do you find our internal communication tools?
Not effective at all | Slightly effective | Moderately effective | Very effective | Extremely effective - How effective are the training programs in helping you improve your skills?
Not effective | Slightly effective | Moderately effective | Very effective | Extremely effective
Read: 6 Sample Employee Engagement Survey Templates For Free
Product Feedback & Feature Evaluation
Product feedback surveys help teams refine features and usability by understanding what customers truly value or struggle with.
Agreement Scale
- The product delivers on what was promised.
Strongly disagree | Disagree | Neutral | Agree | Strongly agree - The interface is intuitive and user-friendly.
Strongly disagree | Disagree | Neutral | Agree | Strongly agree
Importance Scale
- How important is customizability when using our product?
Not important | Slightly important | Moderately important | Very important | Extremely important - How important is integration with other tools for you?
Not important | Somewhat important | Important | Very important | Essential
Quality Scale
- How would you rate the stability of our product (e.g., bugs, crashes)?
Very poor | Poor | Average | Good | Excellent - How would you rate the speed or performance of our platform?
Extremely slow | Slow | Average | Fast | Very fast
Likelihood Scale
- How likely are you to continue using this product in the next six months?
Very unlikely | Unlikely | Neutral | Likely | Very likely - How likely are you to recommend our product to a friend or colleague?
Not likely at all | Slightly likely | Neutral | Likely | Extremely likely
Education & Training Programs
These questions evaluate how learners perceive the effectiveness, quality, and satisfaction of educational courses or training programs.
Satisfaction Scale
- How satisfied were you with the overall learning experience?
Very dissatisfied | Dissatisfied | Neutral | Satisfied | Very satisfied - How satisfied were you with the instructor’s teaching style?
Not satisfied at all | Slightly satisfied | Neutral | Satisfied | Very satisfied
Effectiveness Scale
- How effective were the course materials in explaining key concepts?
Not effective | Slightly effective | Moderately effective | Very effective | Extremely effective - How effective were the assignments in helping you apply your knowledge?
Not effective | Slightly effective | Effective | Very effective | Extremely effective
Agreement Scale
- The training content was relevant to my professional goals.
Strongly disagree | Disagree | Neutral | Agree | Strongly agree - The course was organized and easy to follow.
Strongly disagree | Disagree | Neutral | Agree | Strongly agree
Read: Top 15 Classroom Survey Questions for Better Student Insights
Healthcare & Patient Experience
Healthcare surveys help clinics and hospitals measure satisfaction, quality of care, and communication effectiveness between staff and patients.
Satisfaction Scale
- How satisfied were you with the care you received during your visit?
Very dissatisfied | Dissatisfied | Neutral | Satisfied | Very satisfied - How satisfied were you with the cleanliness of the facility?
Very dissatisfied | Dissatisfied | Neutral | Satisfied | Very satisfied
Importance Scale
- How important is having doctors explain treatment options clearly?
Not important | Slightly important | Important | Very important | Extremely important - How important is appointment flexibility to you?
Not important | Slightly important | Important | Very important | Essential
Quality Scale
- How would you rate the quality of communication with your healthcare provider?
Very poor | Poor | Fair | Good | Excellent - How would you rate the responsiveness of hospital staff?
Very poor | Poor | Fair | Good | Excellent
Frequency Scale
- How often do you receive timely follow-ups after your appointments?
Never | Rarely | Sometimes | Often | Always
Related Read: How AI in Healthcare Surveys Is Improving Patient Experience at Scale
Marketing & Brand Perception
These questions help companies understand how their brand is perceived and how likely customers are to engage or recommend them.
Agreement Scale
- I believe this brand aligns with my personal values.
Strongly disagree | Disagree | Neutral | Agree | Strongly agree - The brand communicates its message clearly.
Strongly disagree | Disagree | Neutral | Agree | Strongly agree
Likelihood Scale
- How likely are you to follow this brand on social media?
Very unlikely | Unlikely | Neutral | Likely | Very likely - How likely are you to purchase from this brand again?
Not likely at all | Slightly likely | Neutral | Likely | Extremely likely
Importance Scale
- How important is eco-friendliness when choosing a brand?
Not important | Somewhat important | Important | Very important | Extremely important - How important is brand reputation when making a purchase?
Not important | Somewhat important | Important | Very important | Essential
Event or Service Evaluation
Post-event feedback surveys help organizers assess attendee satisfaction, content quality, and logistics.
Satisfaction Scale
- How satisfied were you with the event’s organization?
Very dissatisfied | Dissatisfied | Neutral | Satisfied | Very satisfied - How satisfied were you with the speakers or presenters?
Not satisfied | Slightly satisfied | Neutral | Satisfied | Very satisfied
Agreement Scale
- The event met my expectations.
Strongly disagree | Disagree | Neutral | Agree | Strongly agree - The content presented was relevant to my interests.
Strongly disagree | Disagree | Neutral | Agree | Strongly agree
Effectiveness Scale
- How effective was the event in providing networking opportunities?
Not effective | Slightly effective | Moderately effective | Very effective | Extremely effective - How effective were the logistics and scheduling during the event?
Not effective at all | Slightly effective | Moderately effective | Very effective | Extremely effective
Quality Scale
- How would you rate the quality of the event venue?
Very poor | Poor | Fair | Good | Excellent - How would you rate the sound and visual experience during sessions?
Very poor | Poor | Fair | Good | Excellent
Read: The Ultimate Guide to Post Event Survey
Digital Experience & UX Research
These questions evaluate usability, content clarity, and user comfort while interacting with websites, apps, or digital platforms.
Agreement Scale
- The app layout is visually appealing.
Strongly disagree | Disagree | Neutral | Agree | Strongly agree - The navigation feels smooth and intuitive.
Strongly disagree | Disagree | Neutral | Agree | Strongly agree
Satisfaction Scale
- How satisfied are you with your recent interaction on our app/website?
Very dissatisfied | Dissatisfied | Neutral | Satisfied | Very satisfied
Effectiveness Scale
- How effective are our help articles in resolving your queries?
Not effective | Slightly effective | Moderately effective | Very effective | Extremely effective
Importance Scale
- How important is mobile-friendliness when browsing online?
Not important | Slightly important | Important | Very important | Extremely important
Likelihood Scale
- How likely are you to revisit our website in the future?
Very unlikely | Unlikely | Neutral | Likely | Very likely
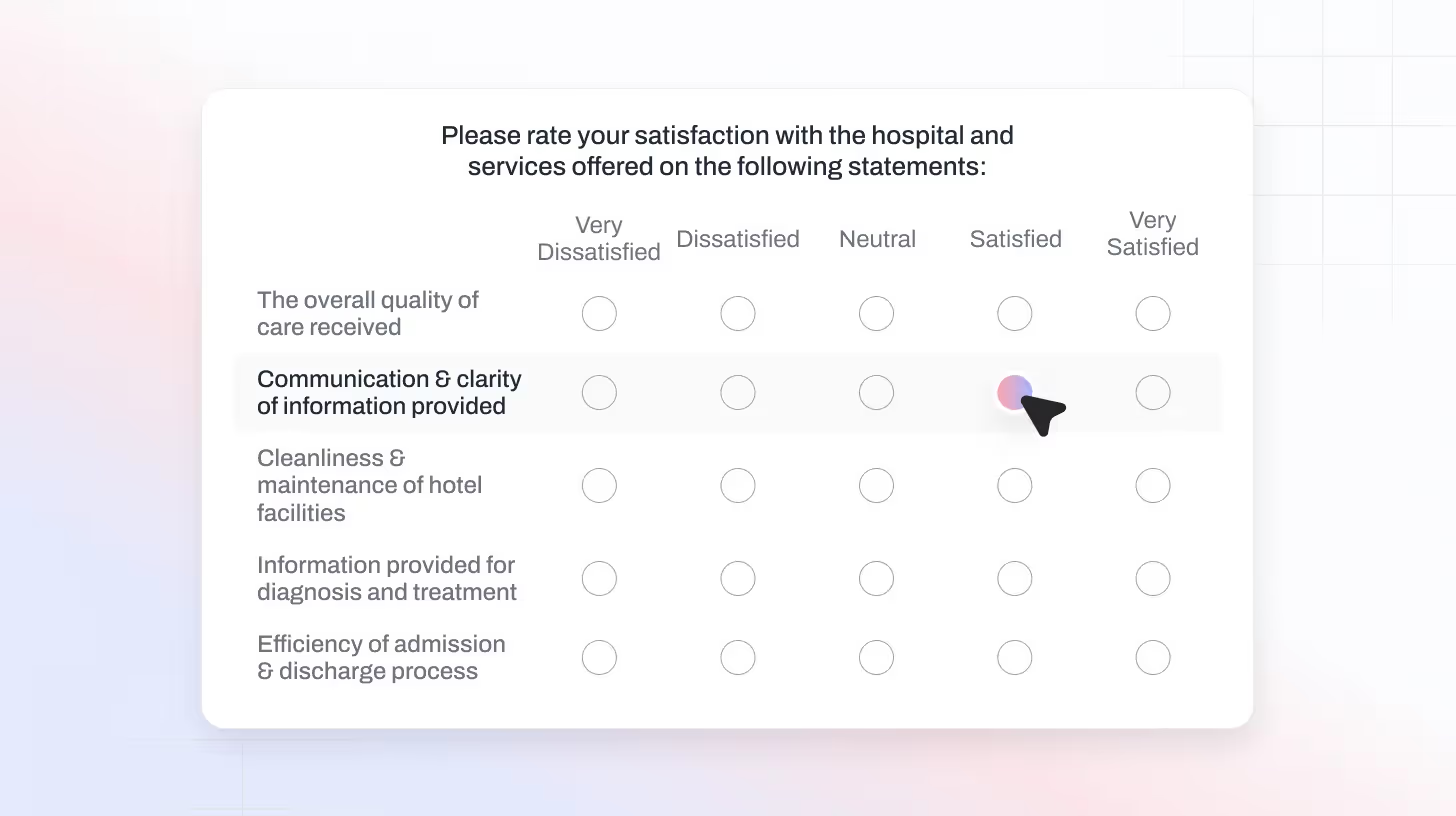
How to Design Effective Likert Scale Questions
Creating the right Likert scale survey goes beyond just writing a few statements; it’s about balancing clarity, consistency, and cognitive ease. The design choices you make directly affect the quality of data you collect.
Choose the Right Scale Range
Decide whether your scale should be short and simple (like 3 or 5 points) or more detailed (7 or 9 points). Shorter scales reduce effort and survey fatigue, while longer ones offer richer insights but can increase response bias. Think about your audience’s patience and your research depth before locking in a scale.
Keep Questions Focused and Contextual
Avoid vague or layered statements. Instead of asking, “How satisfied are you with our service?”, specify the dimension “How satisfied are you with the speed of our customer support?” Focused questions help respondents think clearly and answer accurately.
Write Balanced and Neutral Responses
Each response option should feel evenly spaced in tone, neither overly positive nor overly negative. Use consistent language like “Strongly Agree,” “Agree,” “Neutral,” “Disagree,” and “Strongly Disagree.” Avoid tricky wording or emotional phrasing that may sway responses unintentionally.
Pick Between Even or Odd Scales
Odd-numbered scales (like 5-point) give respondents a neutral middle option. Even-numbered scales (like 4-point) force them to take a stand. Choose based on whether neutrality adds value or introduces vagueness for your research goals.
Statement Formulation
Balance Positive and Negative Statements
Include both positively and negatively worded items. This helps identify respondents who aren’t reading questions carefully.
Example pair:
• “I find the website easy to navigate” (positive)
• “I struggle to find what I need on the website” (negative)
Avoid Double-Barreled Questions
Don’t ask about two concepts in one statement.
Poor: “The product is affordable and high-quality”
Better: Split into two separate statements
Use Clear Timeframes When Relevant
Specify the period you’re asking about. Example: “In the past month, how often have you...”
Scale Design Considerations
Including a Neutral Option
Pros: Allows for genuine neutrality, reduces forced opinions.
Cons: May encourage non-committal responses.
Decision should align with research objectives.
Labeling Points
Fully labeled: Every point has a text label.
End-anchored: Only endpoints are labeled.
Fully labeled scales are generally easier for respondents.
Common Response Formats
These standardized formats help ensure consistency and clarity in survey responses.
Agreement Scales: Strongly Disagree | Disagree | Neither Agree nor Disagree | Agree | Strongly Agree
Frequency Scales: Never | Rarely | Sometimes | Often | Always
Satisfaction Scales: Very Dissatisfied | Dissatisfied | Neutral | Satisfied | Very Satisfied
Quality Scales: Very Poor | Poor | Fair | Good | Excellent
Importance Scales: Not at all Important | Slightly Important | Moderately Important | Very Important | Extremely Important
Likelihood Scales: Definitely Not | Probably Not | Possibly | Probably | Definitely
Numeric Scales: 1 | 2 | 3 | 4 | 5 | 6 | 7 | 8 | 9 | 10
How to Interpret and Analyze Likert Scale Data
Once responses start rolling in, the next step is turning that data into actionable insight. Analyzing Likert scale data requires both statistical and storytelling precision.
Summarize the Response Distribution
Look at how opinions are spread across the scale. Instead of chasing averages, focus on the median or the mode, the most common response category. This shows the true lean of public opinion without distortion from outliers.
Visualize for Better Clarity
Turn your data into visuals, stacked bar charts or heatmaps are great for showing how sentiment clusters. Visualizing responses helps spot trends quickly and makes insights easier to communicate across teams.
Group Sentiments When Needed
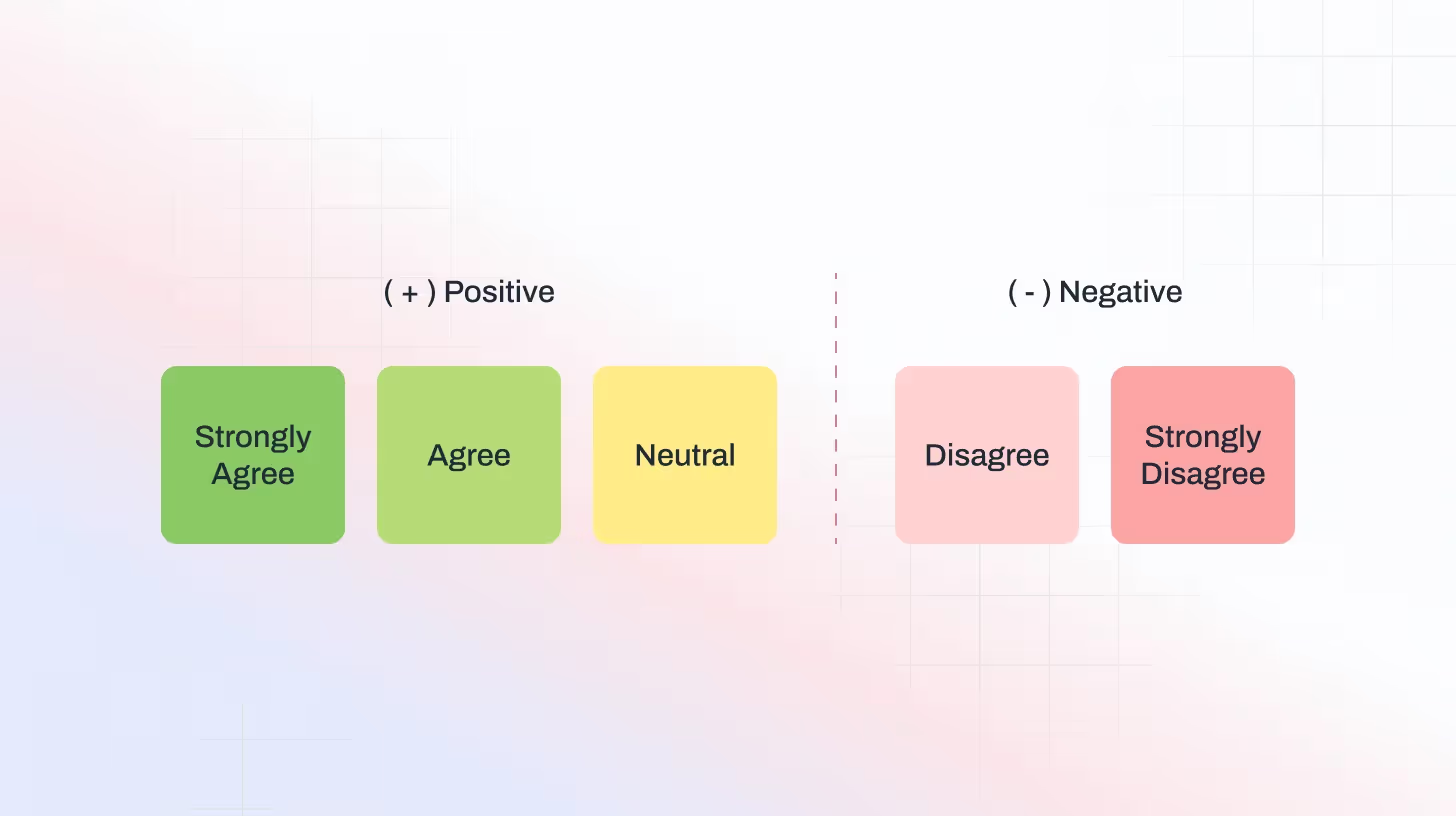
For a simpler picture, merge categories like “Strongly Agree” and “Agree” into a single “Positive” group. This gives stakeholders a high-level sense of sentiment distribution useful for executive summaries or dashboards.
Be Aware of Response Bias
Even the best surveys face bias; some respondents tend to choose middle or positive options to “play it safe.” Keep this in mind when interpreting your data, and if possible, mix question phrasings to balance the responses.
Data Type Considerations
Likert data is technically ordinal (ranked but with unequal intervals). Some researchers treat it as interval data (equal distances between points). This is a longstanding methodological debate in research.
Individual items are analyzed as distinct questions. Composite scales combine multiple related items into an overall score.
Descriptive Statistics
Appropriate central tendency measures:
- Median: Most appropriate for ordinal data
- Mode: Shows most common response
- Mean: Controversial for individual items but commonly used for composite scales
Inferential Statistics
Non-Parametric Tests (Conservative Approach)
- Mann-Whitney U test: Compare two independent groups
- Wilcoxon signed-rank test: Compare two related samples
- Kruskal-Wallis test: Compare three or more independent groups
- Spearman’s rank correlation: Assess relationships between variables
Parametric Tests (Common but Debated)
- t-tests: Compare means between two groups
- ANOVA: Compare means across multiple groups
- Pearson correlation: Measure linear relationships
- Regression analysis: Predict outcomes based on Likert responses
Reliability and Validity
Cronbach’s Alpha
Measures internal consistency of multi-item scales. Values above 0.7 generally indicate acceptable reliability.
Factor Analysis
Identifies underlying dimensions in multi-item scales. Helps validate construct measurement.
Benefits of Using Likert Scales
1. Quantification of Subjective Data
Likert scales transform subjective opinions and feelings into numerical data that can be analyzed statistically, bridging qualitative and quantitative research approaches.
2. Ease of Administration
The format is intuitive for most respondents, requiring minimal explanation and making it suitable for various survey methods including online, paper, and in-person.
3. Flexibility and Adaptability
Likert scales can be used to measure diverse concepts across different contexts, from customer satisfaction to employee engagement, brand perception, and more.
4. Nuanced Insights
Unlike binary questions, Likert scales capture the intensity of opinions, providing a more detailed understanding of respondent attitudes.
5. Standardization
The consistent format allows for comparisons across different questions, time periods, or demographic groups.
6. Established Validity
Decades of research have established Likert scales as valid measurement tools when properly designed and implemented.
Likert Scale Best Practices for Implementation
Following these guidelines will help you design more effective Likert scale surveys and improve the quality of your data.
Survey Design
- Limit the number of items: Keep surveys concise to prevent fatigue; focus on essential measurements
- Group similar items together : Organize by topic or dimension; maintain consistent response formats within sections
- Include instructions: Clearly explain how to use the scale; provide context for what is being measured
- Test before full deployment: Pilot test with a small group; check for clarity and effectiveness
Response Option Optimization
- Maintain consistency: Use the same scale throughout where possible; if multiple scales are needed, clearly distinguish them
- Balance the scale: Equal number of positive and negative options; clear neutral point when appropriate
- Label all points: Fully labeled scales reduce ambiguity; ensure labels are clearly understood
- Consider cultural context: Adapt scales for international use; be aware of cultural response tendencies
Data Collection
- Ensure anonymity when appropriate: Increases honesty, especially for sensitive topics; clearly communicate privacy protections
- Provide adequate time: Allow respondents sufficient time to consider responses; avoid rushing
- Consider multiple channels: Offer paper, online, or mobile options; ensure consistent presentation across channels
Analysis and Reporting
- Document scale properties: Report reliability measures for multi-item scales; explain how data was treated (ordinal vs. interval)
- Present visual summaries: Use appropriate visualizations for Likert data; include distribution information, not just averages
- Acknowledge limitations: Discuss potential biases in your findings; consider complementary qualitative insights
TheySaid - The New Standard for Intelligent, Customer-Led Feedback
For years, companies treated surveys as the end of the feedback process. But the best organizations now treat them as the beginning. Likert scales quantify sentiment, yes, but the real competitive edge comes from understanding the story behind the score.
Platforms like TheySaid are reshaping how leaders listen. By bringing surveys, AI interviews, and actionable insights together, they turn feedback into a strategic engine for retention, growth, and innovation. When customer intelligence becomes continuous, companies stop reacting and start anticipating. That’s the shift defining the next generation of market leaders.
Sign up for free and see how TheySaid transforms feedback into your competitive advantage.
FAQs
What’s the difference between a 5-point and a 7-point Likert scale?
A 5-point scale is simpler and quicker to answer, while a 7-point scale offers more nuance. Use a 5-point scale for short surveys and a 7-point scale when you need detailed insights.
How many Likert scale questions should I include in a survey?
It depends on your goal, but 5–10 well-written Likert questions are usually enough to capture strong insights without causing survey fatigue.
How can I make Likert scale questions more engaging?
Use simple, relatable language and avoid repetitive statements. Mixing question types (satisfaction, agreement, quality, etc.) helps keep respondents interested.





.svg)


